
This week’s infographic, published by the City of Toronto, takes a look at the need for a poverty reduction strategy in Canada’s largest city.
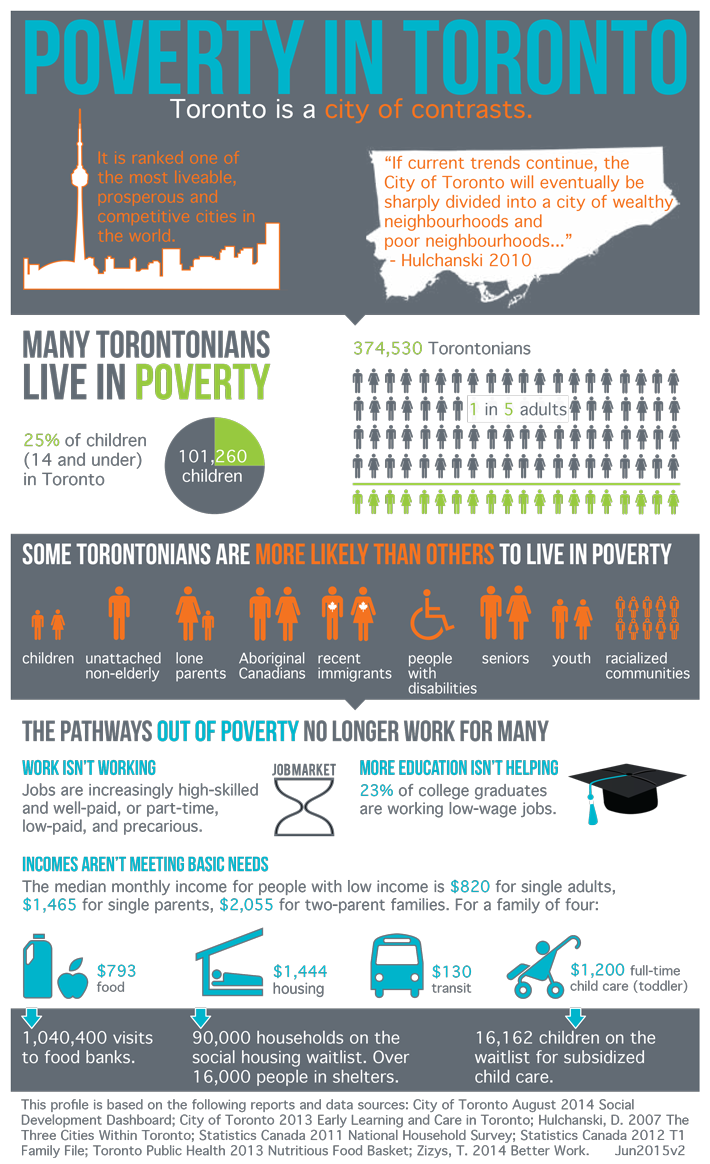
The infographic states that 25% of children in Toronto, and 1 in 5 Torontonians, live in poverty. Gender, race and social status are all factors that play a critical role in the determining who is poor. Aboriginal Canadians, recent immigrants, people with disabilities, seniors, youth and racialized communities are all more likely to live in poverty than others. The infographic also attests that the traditional pathways out of poverty, including employment and education, no longer work for many Torontonians.
The rise of precarious employment, across Canada, means that a job on its own does not guarantee freedom from poverty. This is not to suggest that education, training and employment supports do not have an essential role to play in a poverty reduction strategy, instead the intent of such a statement is to increase awareness about the larger structural factors that contribute to growing poverty.
While regularly ranked as one of the most livable, prosperous cities of the world, Toronto has long been a city of contrasts. Growing income polarization among neighbourhoods in the city has led Dr. David Hulchanski to propose that Toronto is actually composed of three distinct geographical cities according to income: “a prosperous core, a shrinking middle-income belt, and swaths of poor suburbs”.
In the absence of a strong social safety net that helps redistribute wealth, personal income is the key determinant of health and wellbeing. High-income neighbourhoods are associated with better schools, homes, transit and even healthcare services. Dr. Hulchanski’s research found that the three cities are changing over time. The proportion of middle-income neighbourhoods in Toronto continues to decrease, while the proportion of low-income neighbourhoods continues to rise. From 1970 to 2005, the proportion of low-income neighbourhoods in Toronto rose from 19% to 53%.
The rising cost of housing is a key contributor to Toronto’s growing rates of poverty and homelessness. Current shelter allowances that are available to low-income families have not corresponded proportionally to increases in rising rental costs. For example, shelter allowances for single parents with two children have actually shown a net decrease; as the cost of rent has practically doubled from 1994-2013. The infographic states that 90,000 households are on the social housing waitlist. (Keep in mind that an estimated 265, 000 people already live in social housing in Toronto, 50,000 more than the population of Windsor, Ontario). As affordable housing becomes increasingly scarce, it is difficult to understate the need for the construction of new affordable housing units.