
If you’re in one of Canada’s 60+ communities who receive Homelessness Partnering Strategy funds, you’ve probably been thinking about homeless counts in recent weeks. If so, this blog’s for you!
A novel concept?
Believe it or not, homeless point-in-time counts are not a new idea. In fact, some communities have been doing them since the 1990s on an ongoing basis. In Canada, there are over 20 communities who have a history of conducting homeless counts – this number is poised to increase given the recent push for national counts and the development of a consistent methodology through the Canadian Observatory on Homelessness) to align communities across country – similar to the US approach.
You probably know some of the pros and cons to these attempts at enumerating those experiencing homelessness on any given day or night. Of course, looking at homelessness at a point in time is problematic given that people experience bouts of housing instability throughout the year. Point-in-time counts are also likely to undercount certain groups, such as women and youth, who are not as visible in emergency shelters, transitional housing facilities, or street counts.
The promise of harmonized counts
Having said this, there are key benefits that outweigh these issues in practice: counts can provide foundational information about the demographics and needs of those experiencing homelessness in a community. This is especially the case for communities where there is no other source of system-level data (such as HIFIS or HMIS).
They can also be leveraged to kick-start the creation of a coordinated systems approach to Housing First (see the 20,000 Homes Campaign) and act as a community engagement platform to bring new energy and attention to the issue. And if you do them regularly, counts can be part of a toolkit of information you can use to understand population shifts and how these relate to broader macro-economic changes in areas like housing, employment, and migration. Such data can be used in developing system-level responses and highlight areas where policy change and interventions are needed.
A regional perspective
Now imagine you could get 7 cities to agree on the data to be collected, a common timeframe for the count, and then work together to develop a regional picture on homelessness. That’s in sum what Alberta 7 Cities on Housing and Homelessness managed to do last October.
During the upcoming Homeless Hub webinar on March 24, we’ll be discussing some of the results and learnings from this experiment in further detail – but here is a preview of those key learnings from the first-ever provincial homeless count in our country.
Leveraging count data
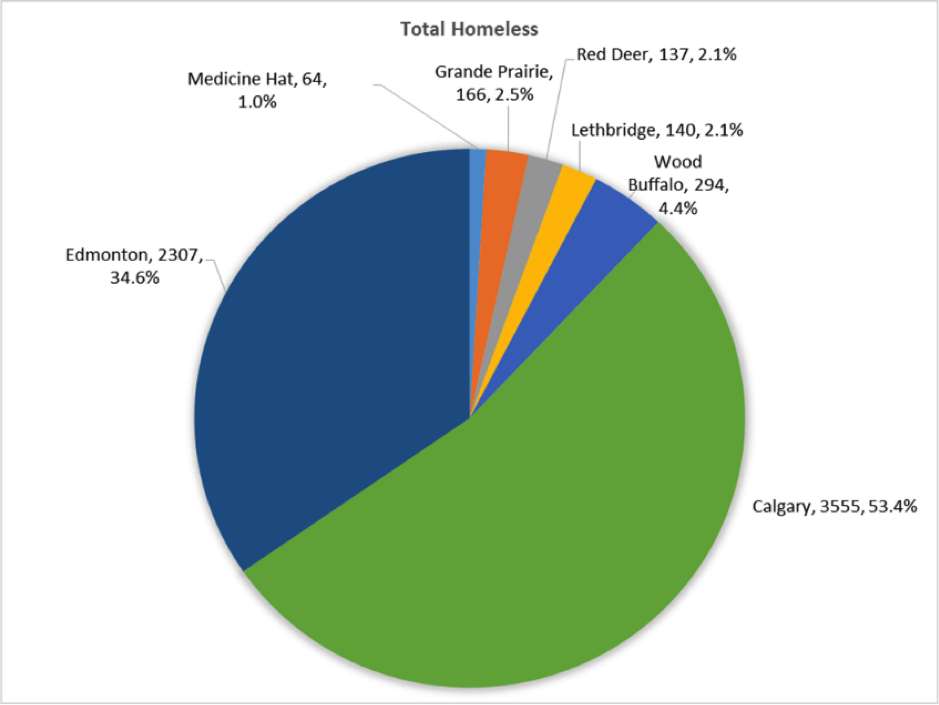
The power of an aligned count is evident if we only look at the most basic finding: the total number enumerated by community. Not a ground-breaking result, but startling in some respects: about 88% of those enumerated in the Alberta count were in either Calgary or Edmonton; the remaining 12% were spread across the smaller cities of Lethbridge, Medicine Hat, Red Deer and the Regional Municipality of Wood Buffalo.
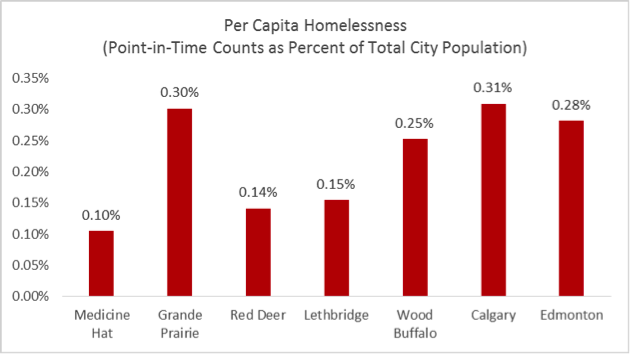
If we look closer at the count figure as a percent of the total city population, a different picture emerges however. The main point here is that aligned methods allow us the opportunity to look at the dynamics involved in homelessness from a comparative perspective.
A broader perspective on homelessness dynamics
We can begin to look at count data in relation other indicators that are regionally available, including census data or CMHC housing market trends.
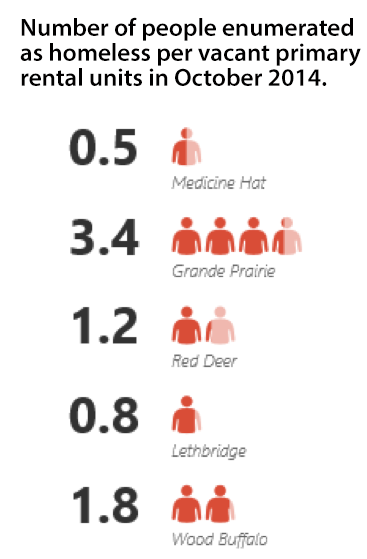
Note for example what happens when we take into account the number of people enumerated per vacant primary rental unit according to the CMHC Fall Rental Market report.
This is an important indicator to consider, as available rental units in relation to demand from potential renters, including those experiencing homelessness, can make a considerable difference in overall affordability along with a slate of other drivers (rental costs, availability of social housing, rent supports, job opportunities/income, etc.).
Though not conclusive, this confirms that any analysis of the relative success of ending homelessness initiatives must be understood in the context of broader socio-economic trends impacting the housing markets locally and homeless counts can be powerful tools to enable such analysis.
The availability of harmonized homeless count data across community has the potential to probe these issues with new information; in some ways, it can further our understanding of the link in the dynamics of housing markets to homelessness, as well as funding and policy decisions’ impact at a community and regional level – most obviously in relation to the need for affordable housing.
Now, let’s look at what else we can examine from a regional perspective: gender, ethnicity, family structure, age, migration, immigration, veteran status, homelessness pattern, etc. Click here to see a summary from the Alberta count on these common demographics elements. Looking at issues that are national in scope, such as the consistent over-representation of Aboriginal people in homeless counts, can be a powerful tool in building responses at the national, provincial/territorial and local levels.
FYI for future counts
Having said that all that, there were still some pitfalls and learnings from the Alberta count. Despite a common method, there were diverse interpretations of some aspects of the approach at a local level which challenge comparability – these are fully examined in the final report.
There were also process issues that popped up at the most inopportune times, but we were committed to finding a solution that worked for everyone, and we did. In the end, the 7 Cities coordinated the release of preliminary reports for each community on National Housing Day in November 2014, and released a final provincial report in February 2015 as a collective. Perhaps in future years we’ll be releasing such reports nation-wide.